So, often working on a data project you will have to report the top items in a group, based on some value. This could be states (group), cities (item), and poverty rate (value). This could be applications (group), metrics (item), and count of occurrence (value). The point is we want to find items in a group that are interesting based on a value.
The setup
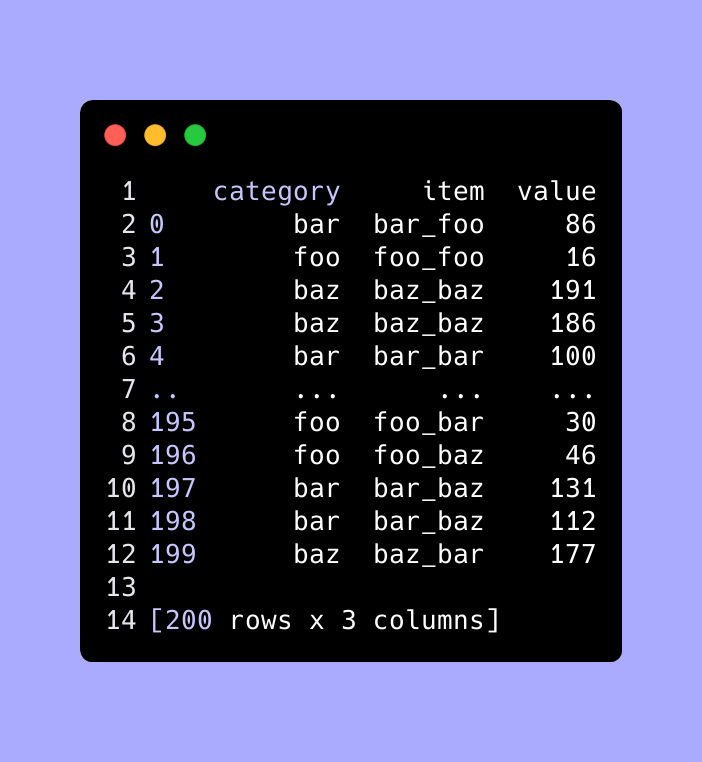
I will use a random dataframe with 3 columns: category, item, and value. Some of the problem domains fit the random data frame, and for some you will have to imagine that the items are completely different names. So imagine that foo_baz is a stand-in for any value.
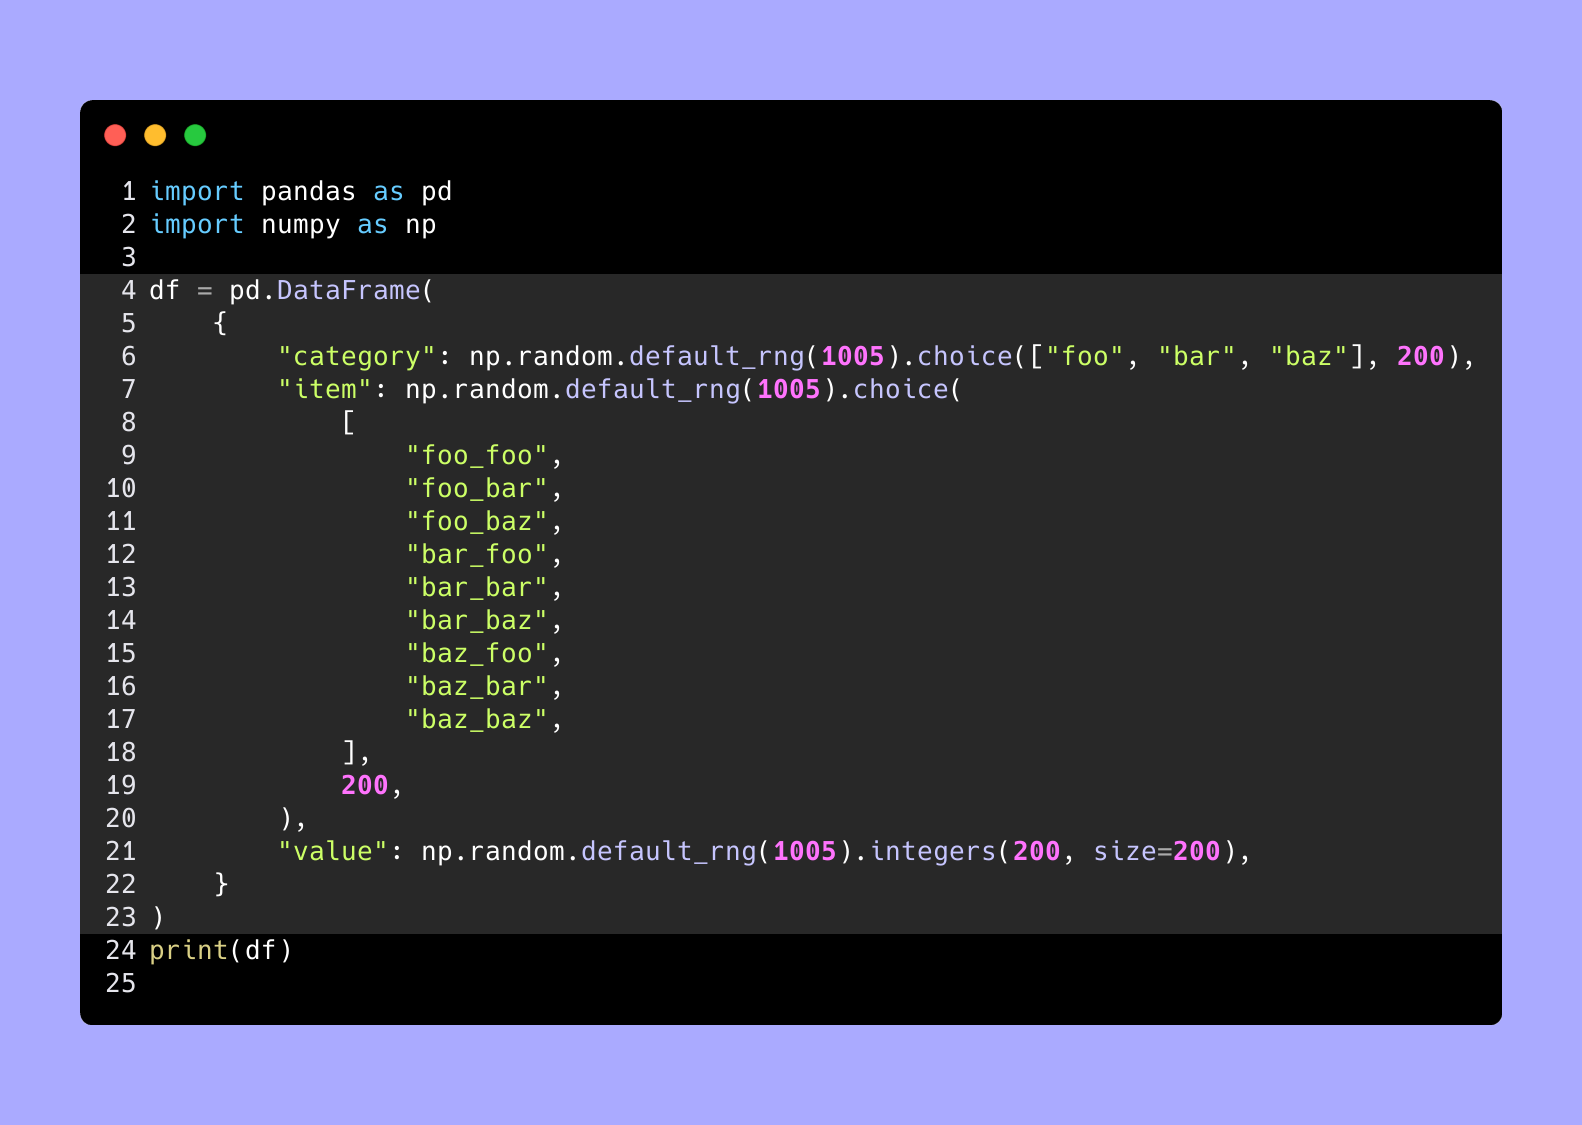
df
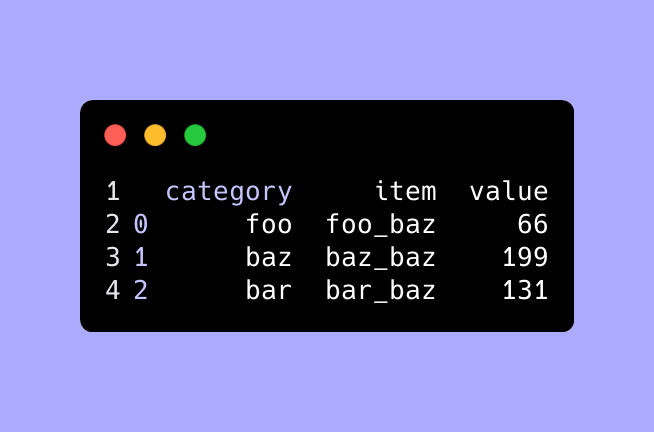
A simple Top N by group
Suppose you want to show someone the Top 1 or Top 10 items by group. Here is what we do: sort the values in a descending order, groupby, and then take the head(N).

Top as a percentage of the group's value
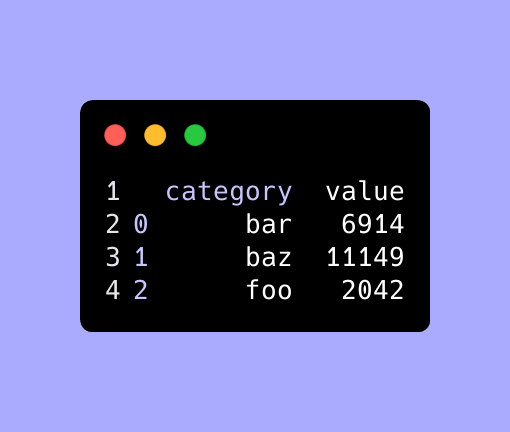
Suppose the dataset is count (value) of votes for a mayoral candidate (item) by city (group). We might be interested in the count of votes if it is above a certain percentage of the total votes cast in that city. We first have to calculate the total votes cast in the city.

df
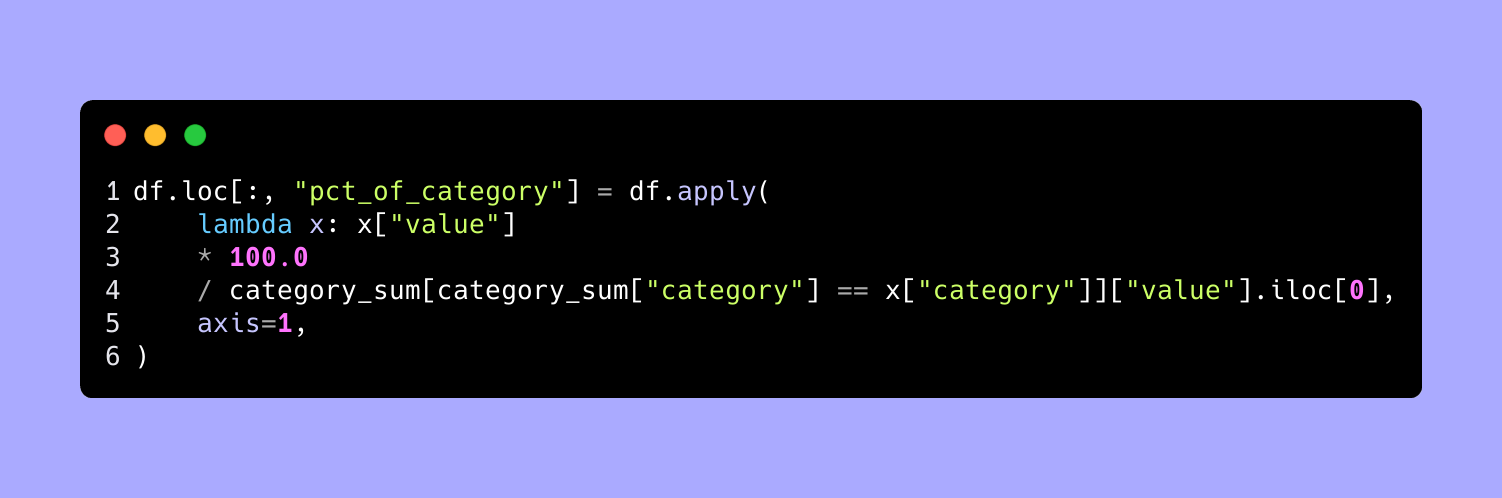
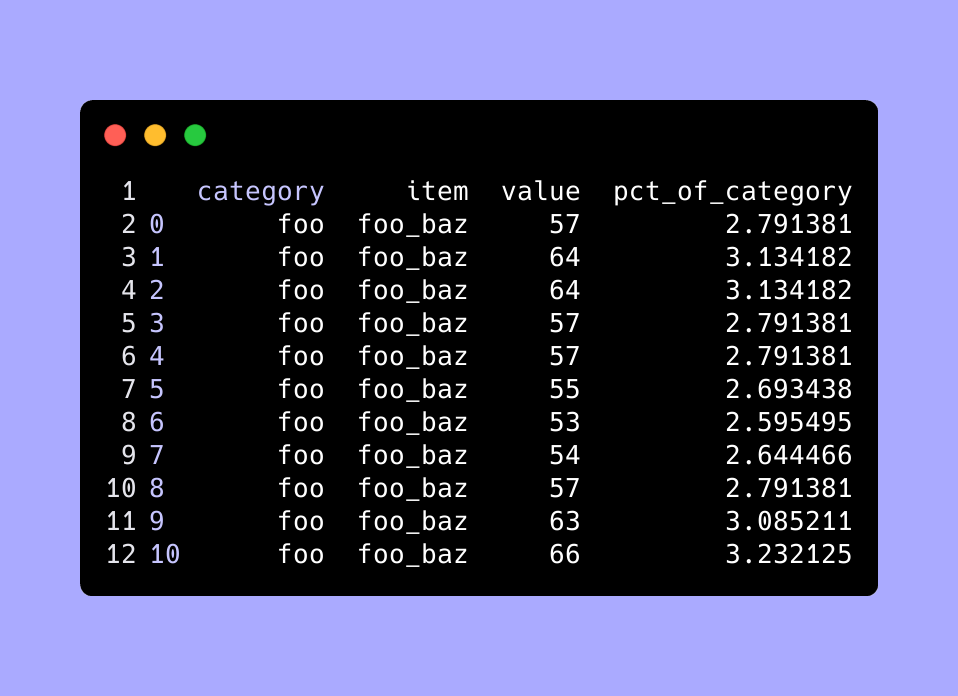
Then we use this grouped-by sum to compute the pct of the item's value in each group. So that is which candidates got over 2.5% of the vote in their city.
We use apply on the dataframe and use axis=1 to apply over the columns, for each row.
df
Top Ntile for the group
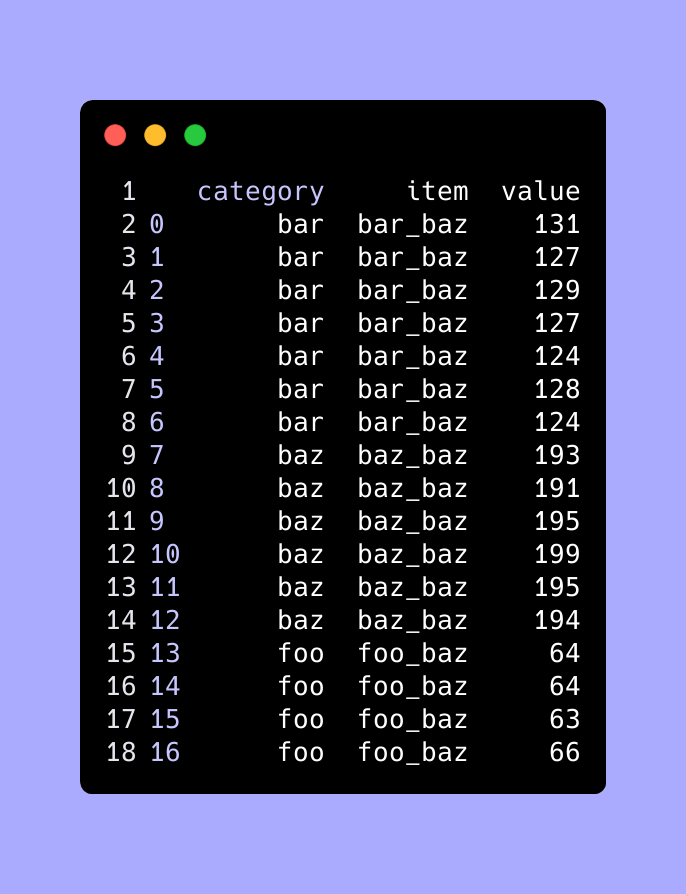
Suppose the dataset is counts (value) of people living in poverty by county (item) and by state (group). We might want to see the # of counties that are in the top 10% of counties in that state, for count of people living in poverty.
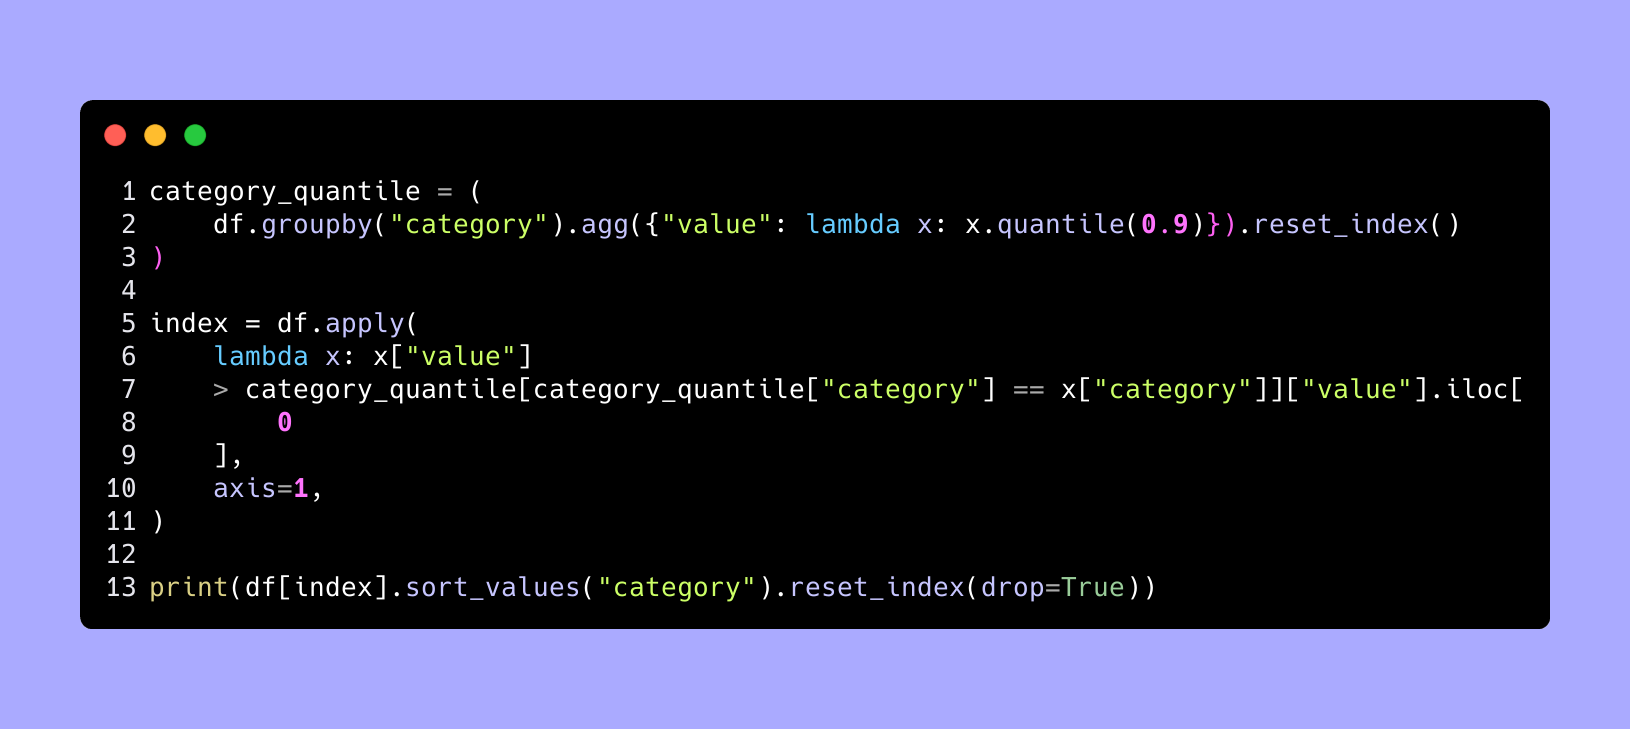
The important part is the lambda with the quantile function and the apply with > and choosing the right ntile for each group.
df
Conclusion
We just went through three ways to give the top items in a group based on a value. This applies to many situations and is generalized in three techniques here: Top N, Top above percentage, and top above an ntile.